
Why We Model Buildings
An architect friend contacted me recently. Could I help him with some energy modelling for his home before he starts a retrofit project?
He wanted to understand the baseline performance and test what the potential improvements might be upon completion. This would give him valuable data that he can use for his business e.g. ‘we reduced the energy use in this home by 30%’.
Of course, I said yes, and not for the first time.

Why We Model Buildings – Design Confidence for Measurable Success
It’s quite a common request I get from other designers who know about the availability of simulation modelling but perhaps don’t have the time or expertise to explore it themselves. For those who understand the value that testing ideas in advance brings, it becomes a regular part of their project workflow.
Some of the reasons why we might use building modelling are:
- To meet an energy efficiency performance target
- To demonstrate compliance with a statutory requirement or certification scheme
- To ensure transparency for reporting and comparisons
- To run design simulations for design optimisation before construction commences
- To help justify the value of design decisions
- To produce better buildings, closing the so-called Performance Gap.
Modelling a building before we build it is our way of kicking the tyres and taking the car for a spin before handing over the Reddies. It seems totally logical to do this in any other sphere of life. Ever bought a new sofa without sitting on one in the showroom first? Bought a mattress without kicking off your shoes and stretching out? Drunk a bottle of wine in a restaurant without first assuring the waiter, ‘oh yes, it’s delicious’?
With powerful tools at our disposal, we don’t need to hit and hope with our designs. A swathe of performance criteria like energy use, estimated annual bills, overheating risk, daylighting and solar PV generation can be modelled and optimised in advance. This can direct efforts to the key areas, understanding how design decisions interact, and allows many options to be tested quickly and cheaply.
What we are not talking about here is static visualisations or ‘renders’. These are great for communicating forms and spaces to people who might struggle to read 2D plans and sections. Likewise, we will not cover embodied carbon optioneering, as this is covered in other Detail Library articles.
This article explores the ways in which we as designers can use iterative modelling throughout the project’s life, to simulate performance outcomes for our clients (or builders) and produce better buildings that more closely match their expectations.
Mind the Gap
We still have a big problem with design expectations versus reality, known as the Performance Gap. The Performance Gap is a real issue that threatens reputations, investors and future purchasers. It can also kid us that we’re being sustainable and reducing carbon when we’re not.
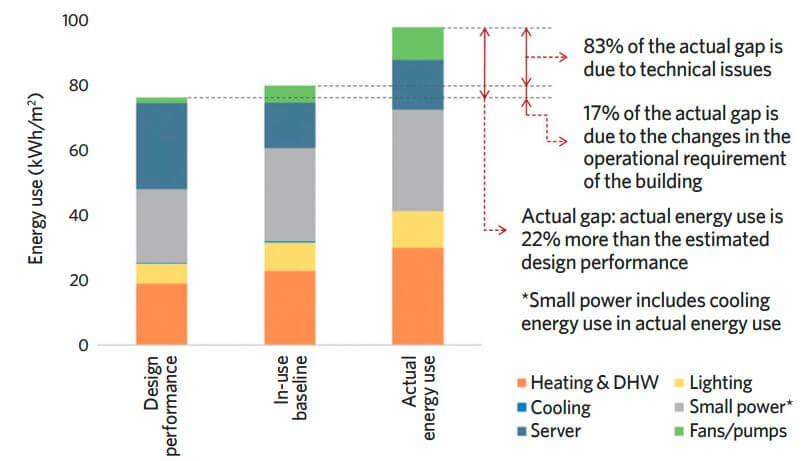
Image Credit: CIBSE Performance Gap
Some common reasons why buildings often miss their target include:
- They don’t have a target!
- Design models only cover part of the energy usage
- Commissioning of key building plant does not follow the design intent, relying on standard approaches or default settings
- The buildings are used in a different way (or with different occupancy patterns) to how they were intended.
Modelling With a Purpose
Returning to the sofa warehouse, you spent some time selecting your favourite fabrics. But when you took delivery, it was a different colour and was too big for the room. You’d have a good case to complain. Sadly, in the world of construction, the bar of expectation is set far lower. They shrug and remind you ‘every building is a prototype’.
If modelling is only carried out to reach a project gateway, like Building Control compliance at RIBA Stage 4, it only has one purpose. This type of modelling runs parallel to the building design process but is not integral to it. The result of this approach is that most buildings fail to perform the way they were designed to, often because these checks come too late.
We know this from the tiny fraction of those that are actually tested or undergo any form of post-occupancy evaluation (POE). Failure commonly relates to the intended energy use being far higher than anticipated, or poor user comfort. The majority are never tested, because frankly, who really wants the bad news and a post-match punch-up?
Not meeting a target can have wide reaching implications for the client, and financial impacts could rebound onto the design team and contractor. These could be:
- Missing a compliance goal linked to statutory consents or funding.
- Higher energy bills for the occupants.
- Remedial works or lengthy re-commissioning required.
- Lower EPC or CEPC score affecting rental ability or price per square foot.
- Mismatch between commercial EPC score and Display Energy Certificate based on actual use.
- Negative impact on public relations for those who must report on energy use.
- Risk of litigation by the client or end user.
kWh Confusion
One reason why energy targets aren’t met is the way measurements are interchanged indiscriminately. Primary Energy, In-Use Energy, Delivered Energy, Energy Use Intensity, Primary Energy Renewables are all metrics that use ‘kWh’ but mean completely different things. One metric may help you achieve Building Regulations compliance and another a more favourable marketing campaign. They can be used to deceive, affecting how success is measured and if expectations are ultimately met.
Those encouraging clarity over energy performance targets (like LETI, UKNZBS) have converged behind Energy Use Intensity (EUI) as the most transparent way to represent operational energy. EUI is a metric that designers can use as it can be modelled up front and easily tested in operation using energy bills. But both key compliance routes in the UK, SAP (or RdSAP for domestic) and SBEM (commercial), use metrics that exclude unregulated energy (or plug loads) so cannot be compared to EUI or the kWhs homeowners see on their bills.
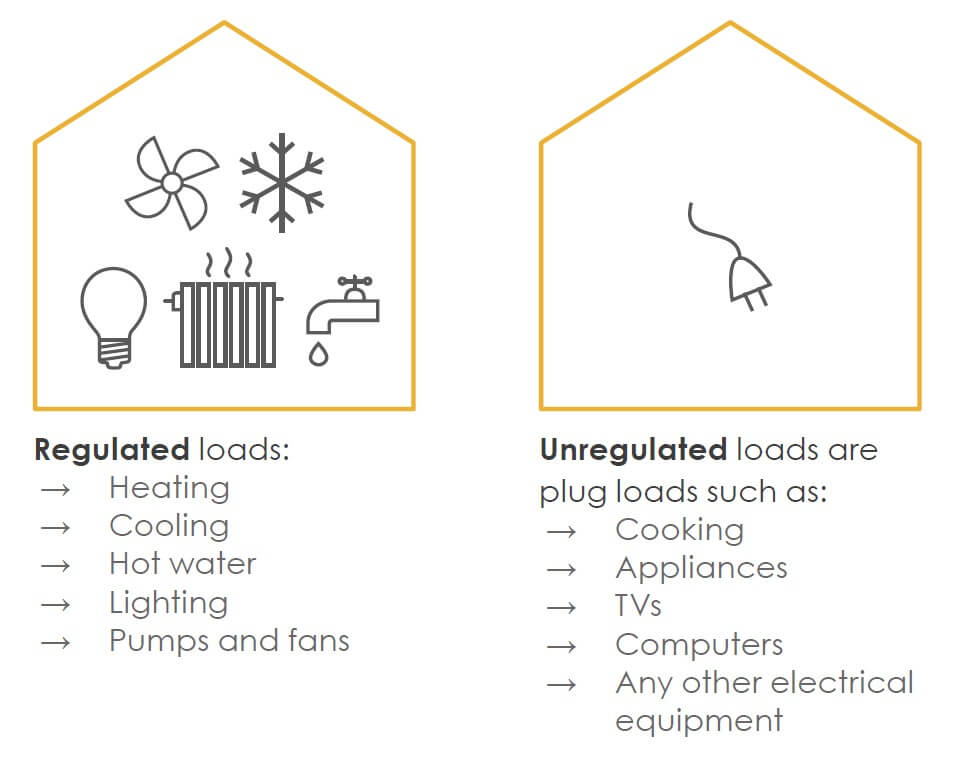
Image Credit: LETI Climate Emergency Design Guide
Most commercially available retrofit modelling platforms rely on existing EPCs as their baseline. The reason why this is not considered best practice is the known inaccuracies in EPCs using RdSAP (typically 25-30% inaccurate). Using the raw XML data, new measures can be applied and the EPC score simulated based on suggested measures. How could reliable future outcomes be trustworthy when based on such shaky foundations?
If you are stating building energy use data and the expected outcomes, be transparent about what is included, how it can be measured and ratified once completed. If you are using EPCs as your baseline, be clear about the large margin of error built into any projections.
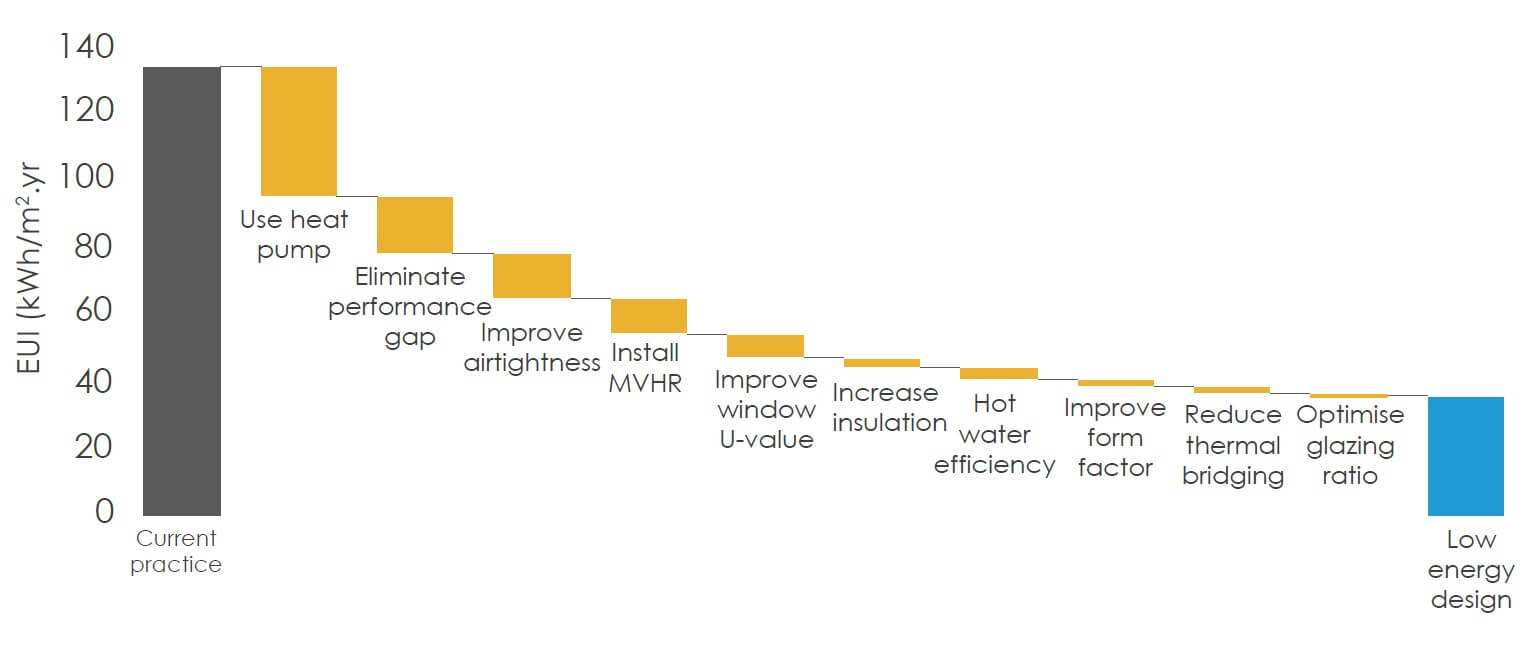
LETI show that eliminating the Performance Gap is the second biggest way to save energy, behind installing a low carbon heat pump.
Modelling Guidance
To steer good practice, LETI produce their own guide for designers (LETI Operational Modelling Guide – How energy performance modelling helps deliver energy targets) using EUI. This follows the CIBSE TM54 methodology (Evaluating operational energy performance of buildings at the design stage) which also coins the term ‘energy performance modelling’. Their process involves setting an aspirational (but realistic) target for both EUI and Space Heating based on the building type.
LETI say, ‘Meeting net zero EUI targets will only be fully demonstrated once a building is occupied, using the actual meter readings, but teams need to know early on if their design is capable of meeting the operational targets they have signed up to.’
That’s the key – having confidence that the design will deliver as expected. Following a process in a collaborative and transparent way reduces your personal risk as well as the overall project risk.
To protect ourselves whilst acting in the client’s interests, there are simple steps we can take to address these common failings:
- Start as early as possible with targets written into the brief
- Use the design right tools (by those trained to use them)
- Ensure the modelling is iterative and can both adapt to, and inform the design
- Be mindful of the limitations of any tool – none are perfect
- Share energy models within the design team so they can be checked (even consider independent peer review)
- Use sensible tolerances for unknown factors. Tolerances can be reduced as design certainty increases.
- Stress-test the design for future impacts like heat waves, higher occupancy or reduced ventilation.
- Commit to test the building at the end, so everyone knows there will be scrutiny and potential consequences for a large gap in performance.
None of this is a guarantee of course, but it demonstrates commitment and best endeavours are being used. It can be easy to forget the purpose is not to create a perfect model, but a better design that in turn produces a better building.
Example – A Single Family House
Let’s look at a hypothetical design of a single family house, and look at the modelling techniques that can be used and the outcomes that can help the design process.
The Passivhaus Planning Package (PHPP) is a heat balance simulation tool, and one of those recommended by LETI who say,
‘PHPP offers a flexible, robust and useful energy calculation. When compared to in-use monitoring of buildings it closely matches the average performance, especially in low energy buildings.’
One of the primary reasons for the rise in the Passivhaus standard is that it produces buildings that have been proven to perform as intended. This advantage can be jointly credited to the rigour of the design process and the on-site quality assurance that is so lacking in regular construction. Attempting to mimic this approach (e.g. the dreaded ‘Passivhaus Principles’) misses the point entirely and leads to square pegs being bludgeoned into round holes.
Some of the key outputs from PHPP include:
- Form factor – a simple analysis of the ratio of floor area to surface area, which drives efficiency of the overall form.
- Where the heat is being lost – tabulated breakdowns of building elements and their orientations.
- Impact of glazing on solar gain – illustrating the extent to which glazing contributes to helpful winter solar gain (free heating) and unhelpful summer solar gain (overheating). This can help rationalise the size and location of windows and rooflights.
- As buildings are geolocated, accurate weather data can be assigned. Shading can be factored in by modelling overhangs, setbacks and adjacent buildings or trees. This further refines the overheating risk analysis and helps the specification of g-values.
- The impacts of different heating systems and the anticipated losses from pipework runs and hot water cylinders.
- Using ‘Variants’ is a way to assess multiple design options side-by-side so the effect of individual design decisions can be quantified: double glazing vs triple glazing, varying thicknesses of insulation, different component options for building plant.
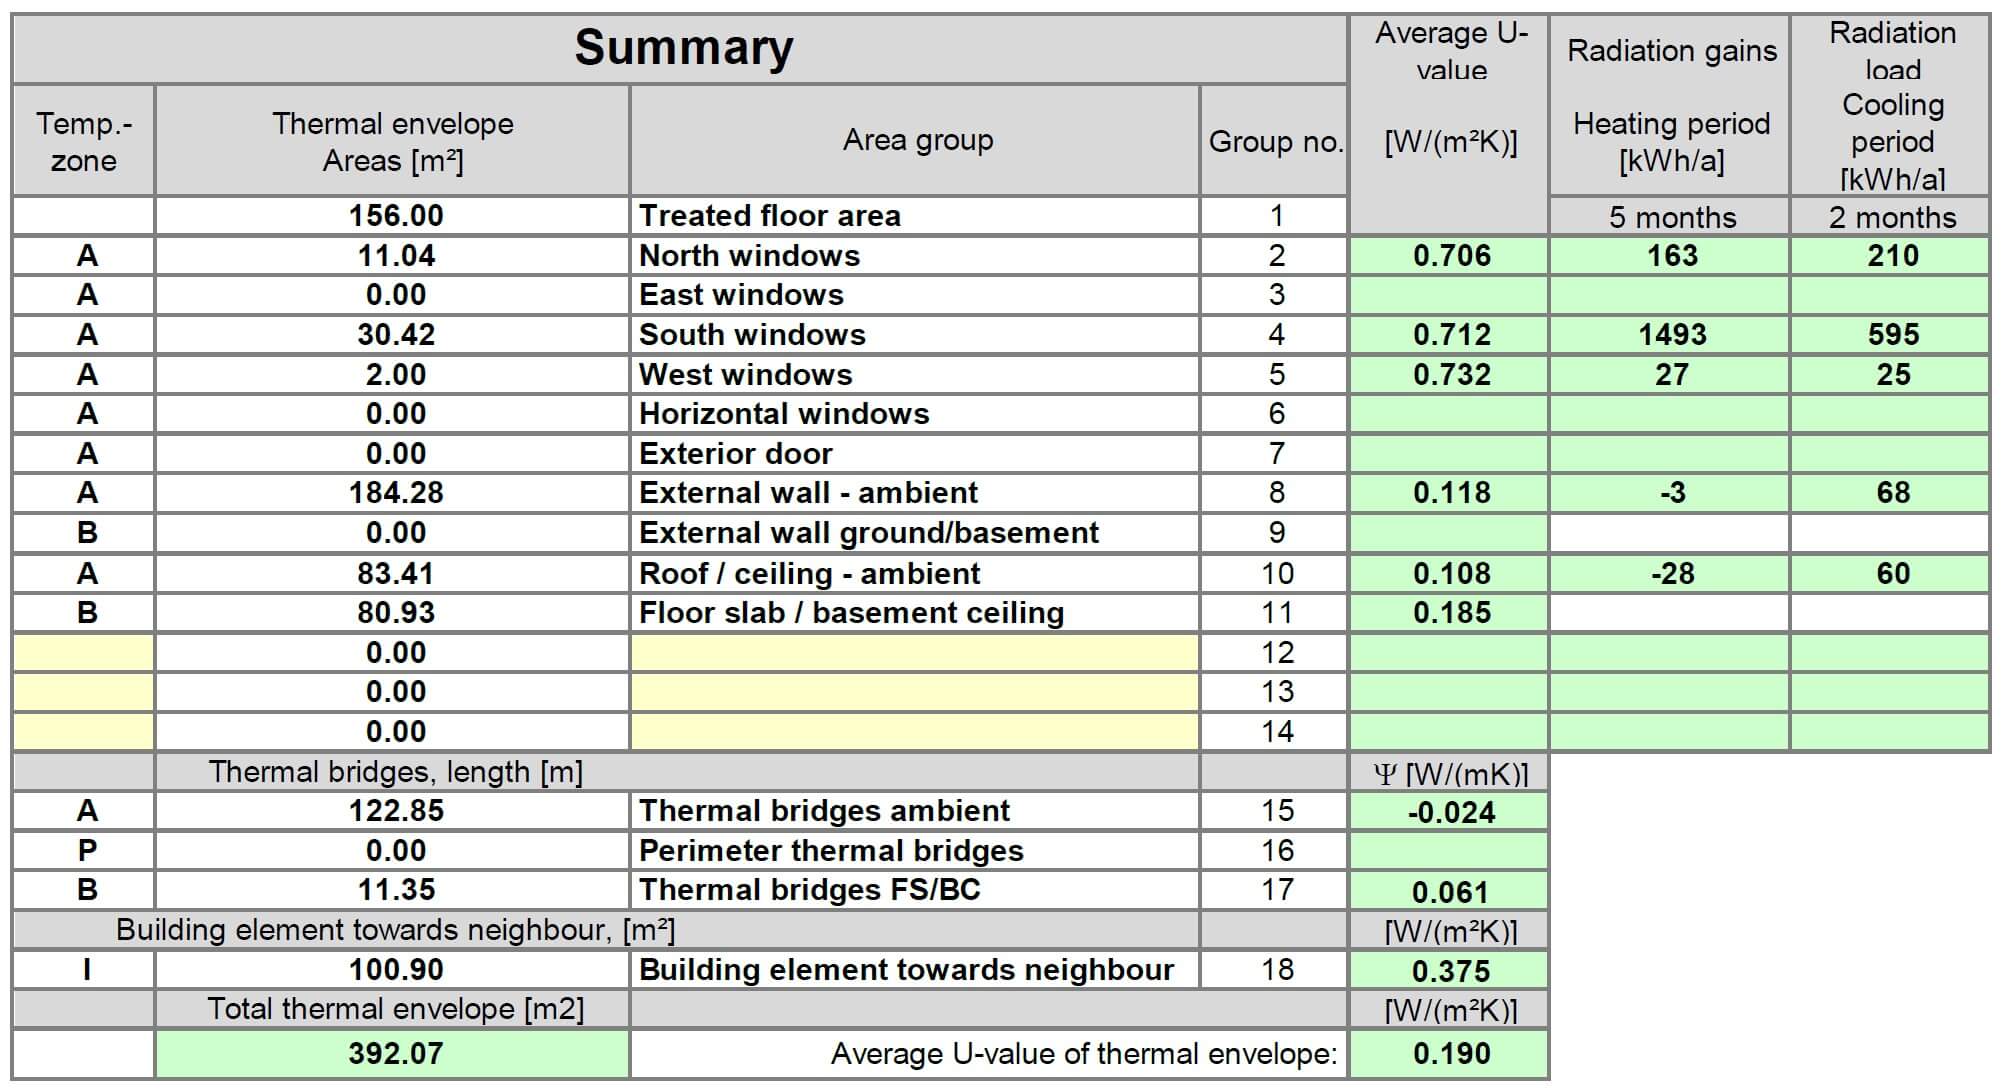
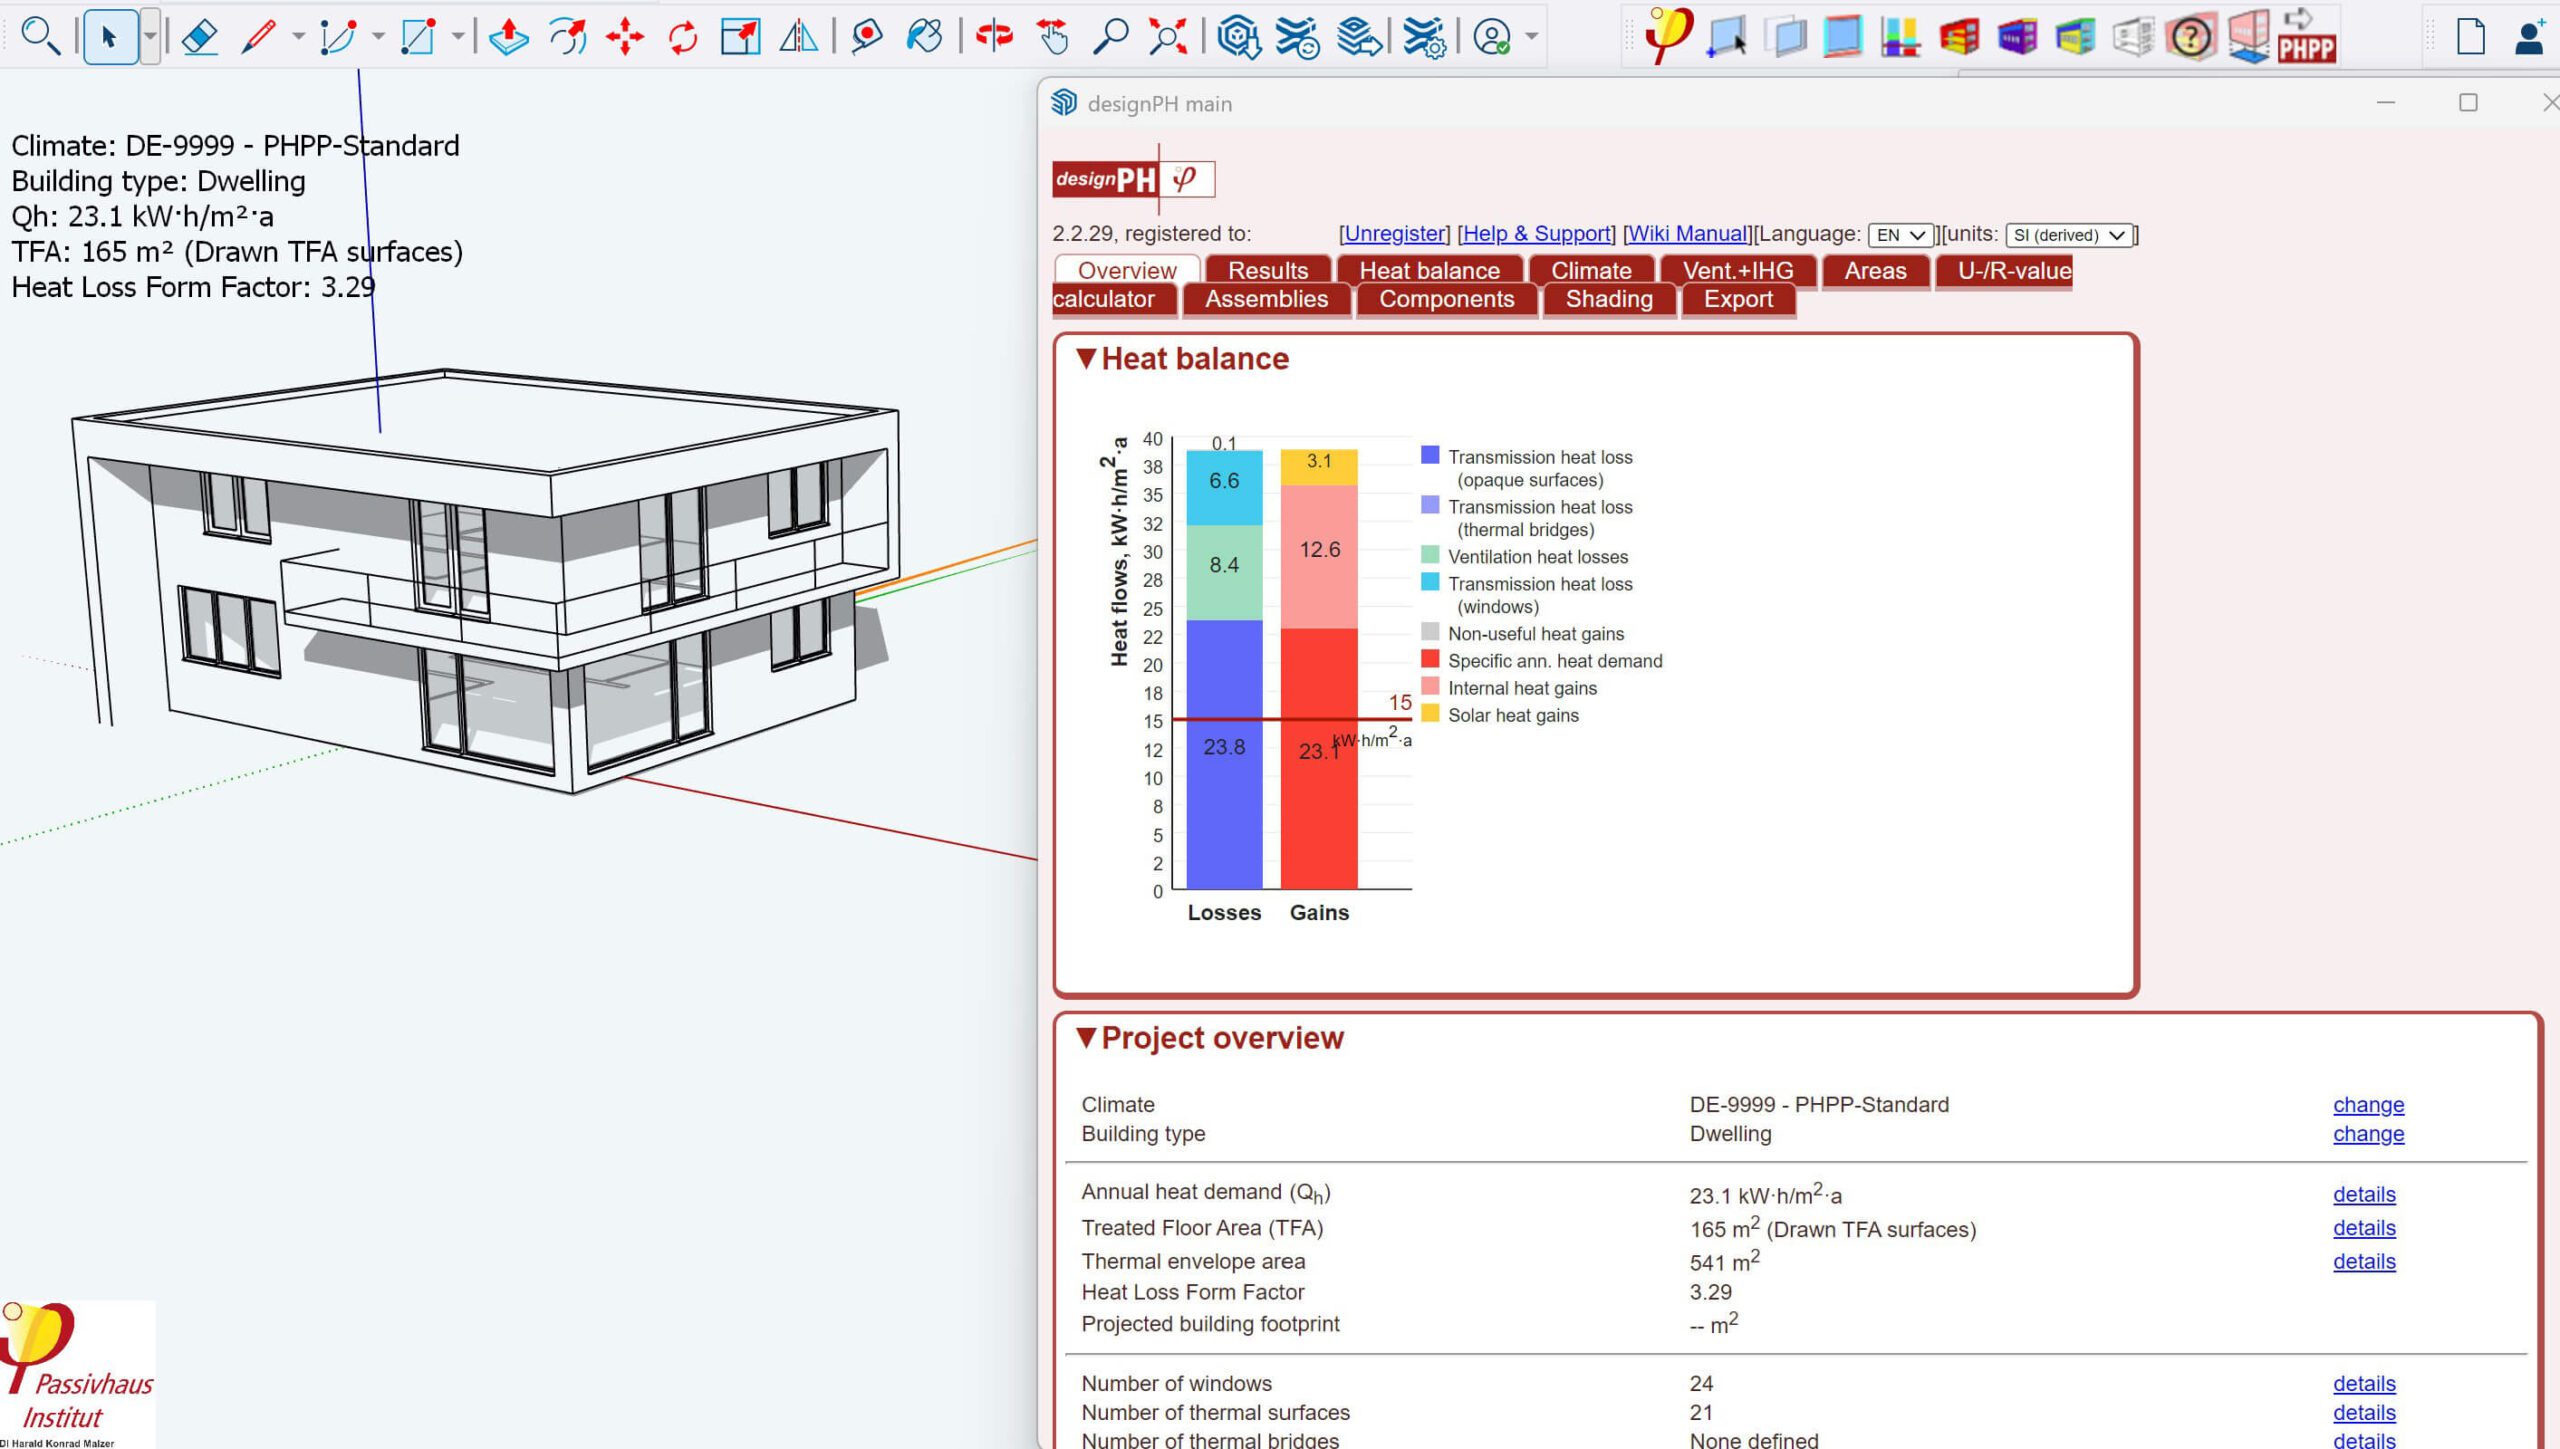
PHPP example showing a summary of performance of the whole fabric
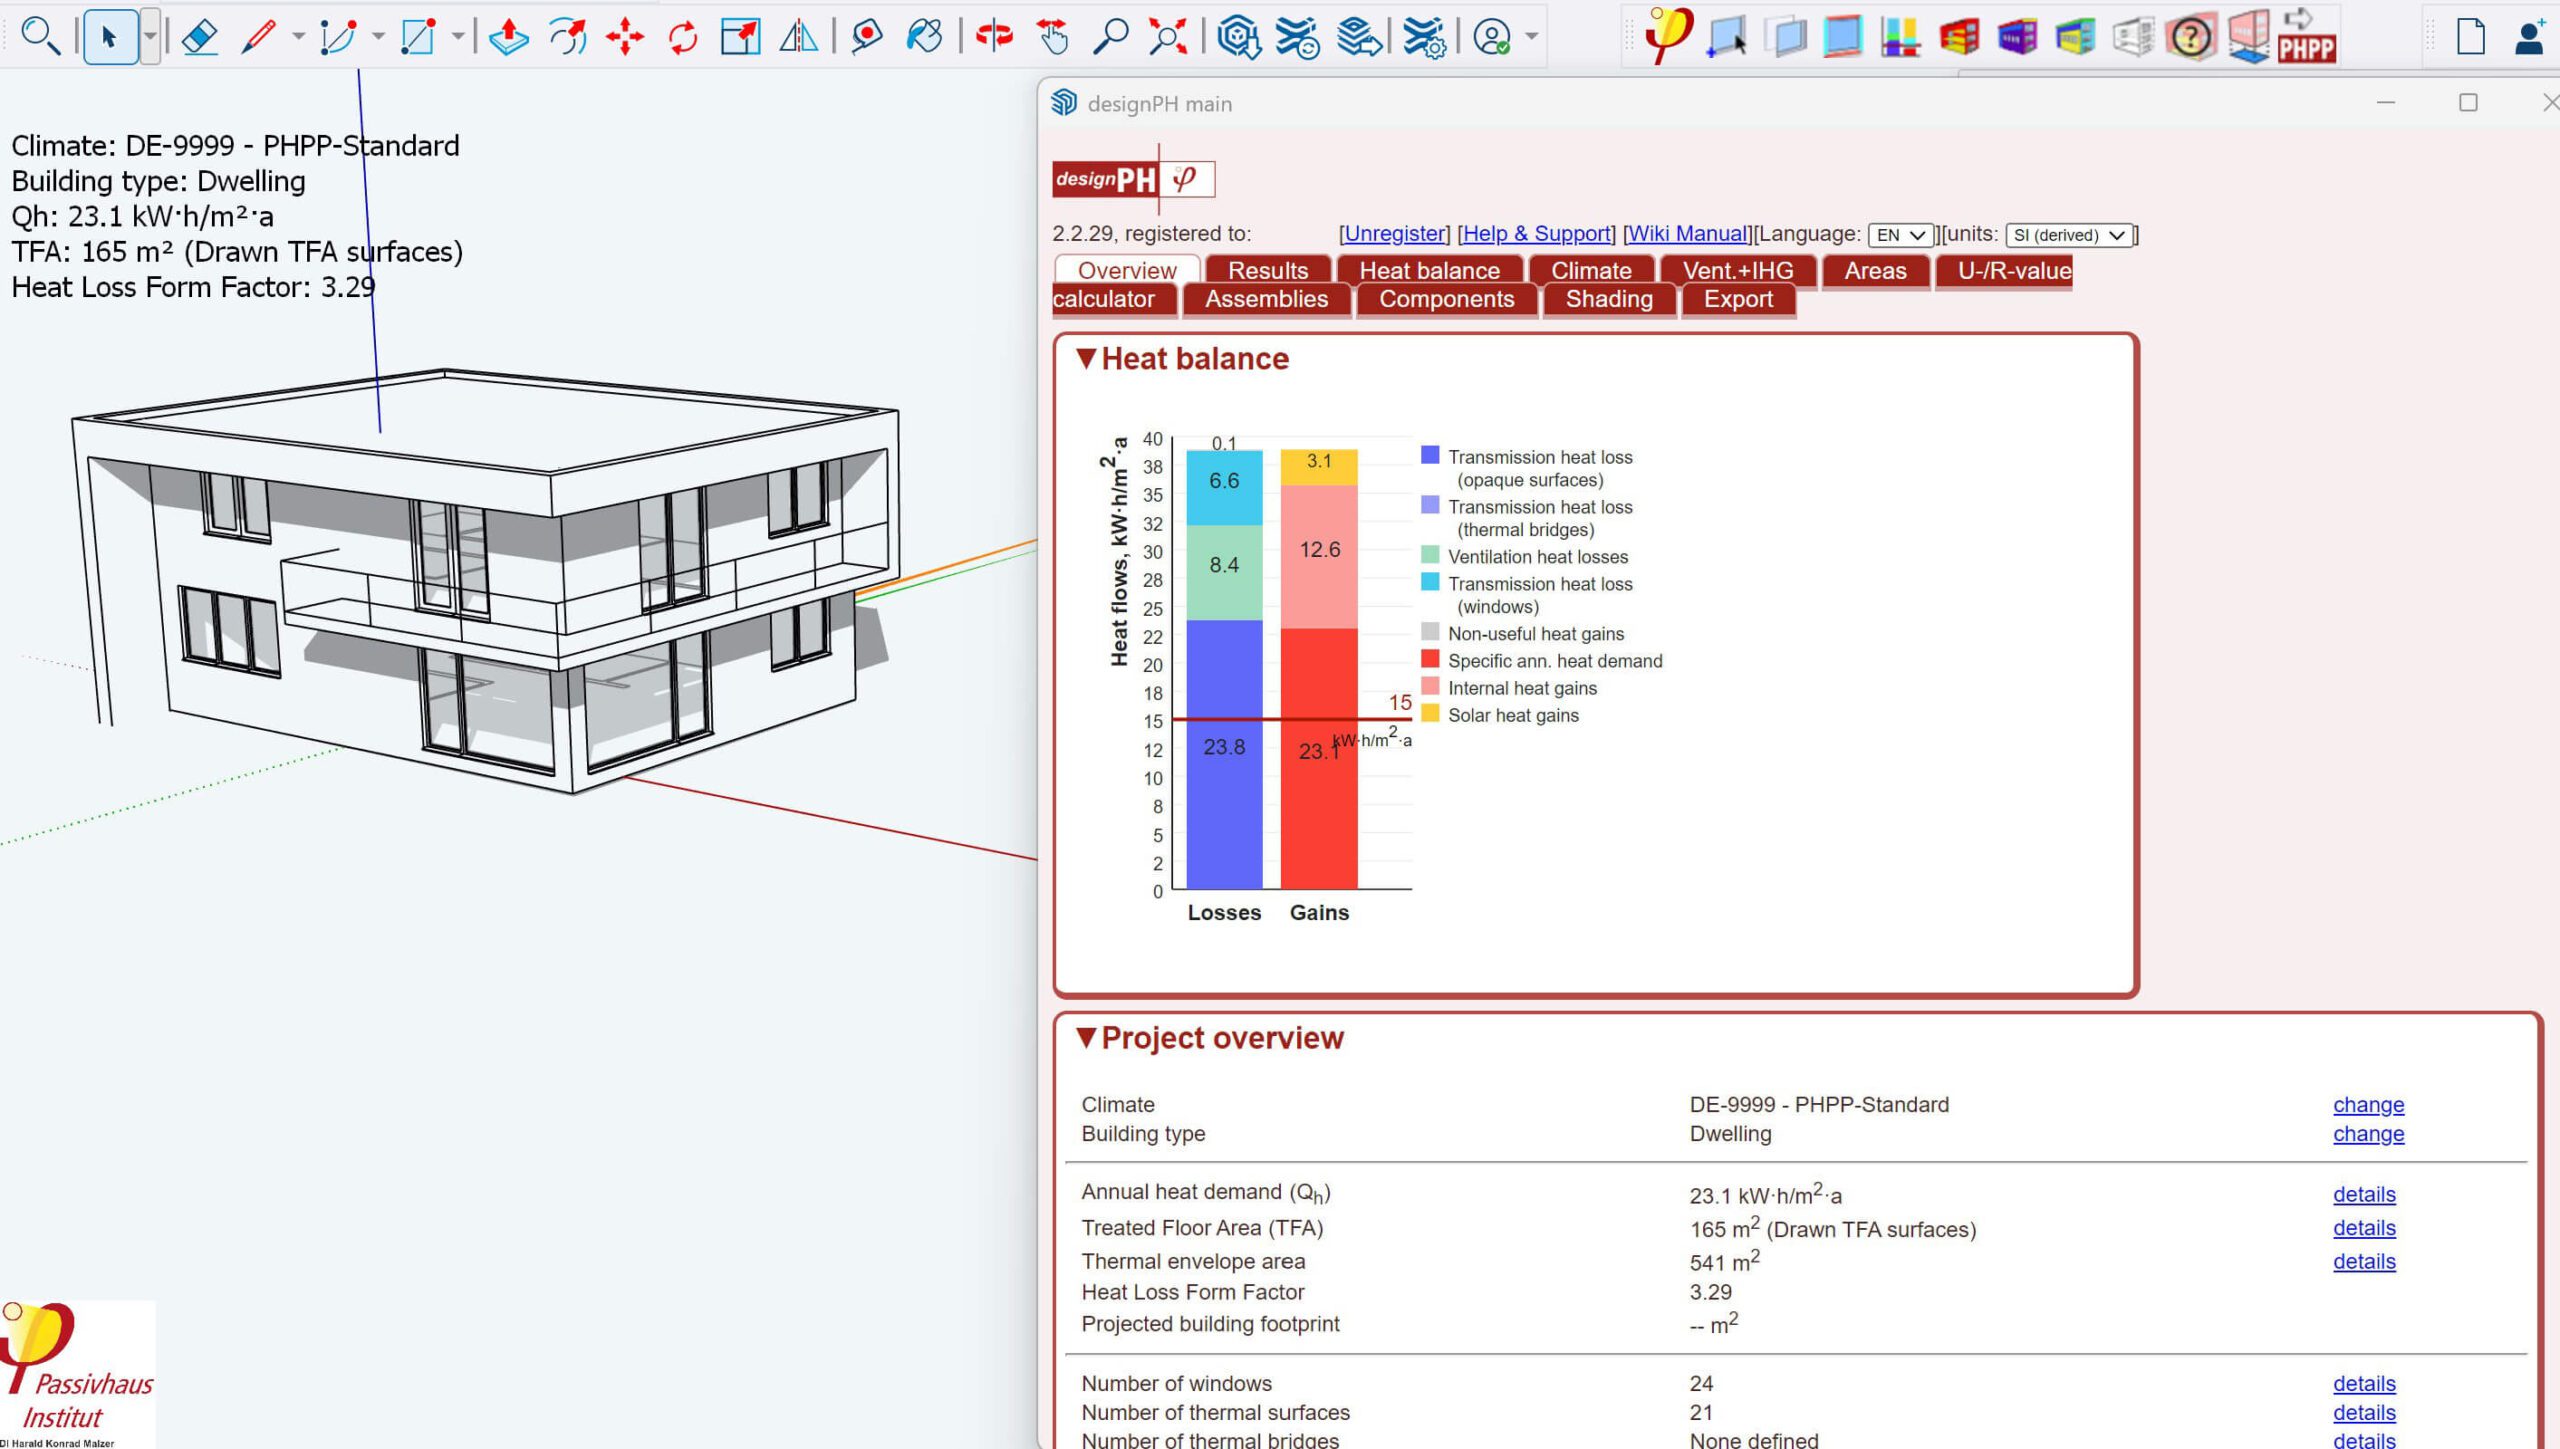
PHi example model for DesignPH
For more complex, commercial schemes, LETI recommends software like IES or DesignBuilder which are classed as Dynamic Thermal Modelling tools which take a more granular, hour by hour approach to simulation. In the same way that PHPP gives benefits over domestic SAP, these tools give far greater performance certainty than Part L2’s SBEM (Simplified Building Energy Model).
Energy Bills
For energy bills analysis, this can be simulated using third party plugins for PHPP. Note as PHPP uses m2 in Treated Floor Area (TFA), you’ll need to convert this into Gross Internal Area (GIA) for a true EUI comparison. The plugins help convert standard outputs into EUI to show anticipated annual energy bills for gas (if present) and electric. This is another great way to illustrate the longer-term payback of high-quality components that may carry a higher capital cost.
Space Heating Benchmarking
Space heating and hot water represent >75% of energy use in most homes. Any modelling tool that estimates a final space heating demand will allow you to benchmark the design against industry best practice.
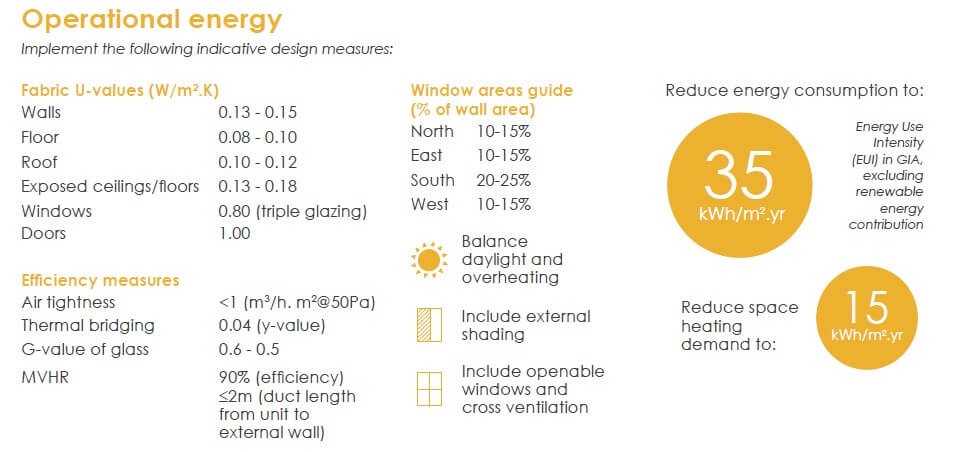
LETI image for small scale housing benchmarks
For a new build detached home, LETI recommends an overall EUI of 35 W/m2K and space heating of 15 W/m2K, a form factor 1.7- 2.5, using MVHR for ventilation and maximising roof coverage for PV (which of course affect orientation). In a few hours you can test a basic concept at Stage 1 against all these criteria, emphasising the earlier these principles are embedded, the cheaper they become to incorporate. This allows early option studies to be assessed not just on looks but also performance.
Air Leakage and Thermal Comfort
If you set an air leakage target, you must have a strategy for getting there. It is said you can only design for an air leakage of zero – that is, you do not get air seal tapes (or standard details) that give you an air permeability of 1/2/5/8 m3/hr m2 @ 50 PA. Detailing for best practice should return a low air leakage value, but you may wish to simulate what this means if the result is 0.6, or 1, or 4. How will this impact on the ventilation efficiency, the internal comfort or bills?
Running a model with different parameters will help you find that target sweet spot, which must then be followed through in the design, on the details and in the specification. A site-based airtightness champion should be nominated to coordinate the trades and ensure intermediate air testing is carried out through the build.
The Passivhaus Trust produce a plug-in for internal thermal temperatures where heating cycles can be simulated. It may show that a target of 18°C drops to 17°C during February, which can ultimately be discussed with a client and if they deem this an acceptable aberration. This is a particularly useful tool for retrofits where internal temperatures are less likely to be as stable as a new build Passivhaus, or target 20°C everywhere.
Stress Tests
External conditions are not static and expected to become more erratic with the effect of Climate Change. Applying stress tests to your designs ensure internal comfort is maintained as the building responds to future variables. Common parameters to check are higher external temperatures (summer heat waves) or increased occupancy (therefore higher internal heat gains) which create conditions for overheating. If the design fails these tests, then you may be designing too short-term.
Adding shading devices could help, but don’t be persuaded to turn to active cooling, which use both expensive electricity and environmentally unfriendly refrigerant gases. Good design alone should tackle most UK overheating risk scenarios.
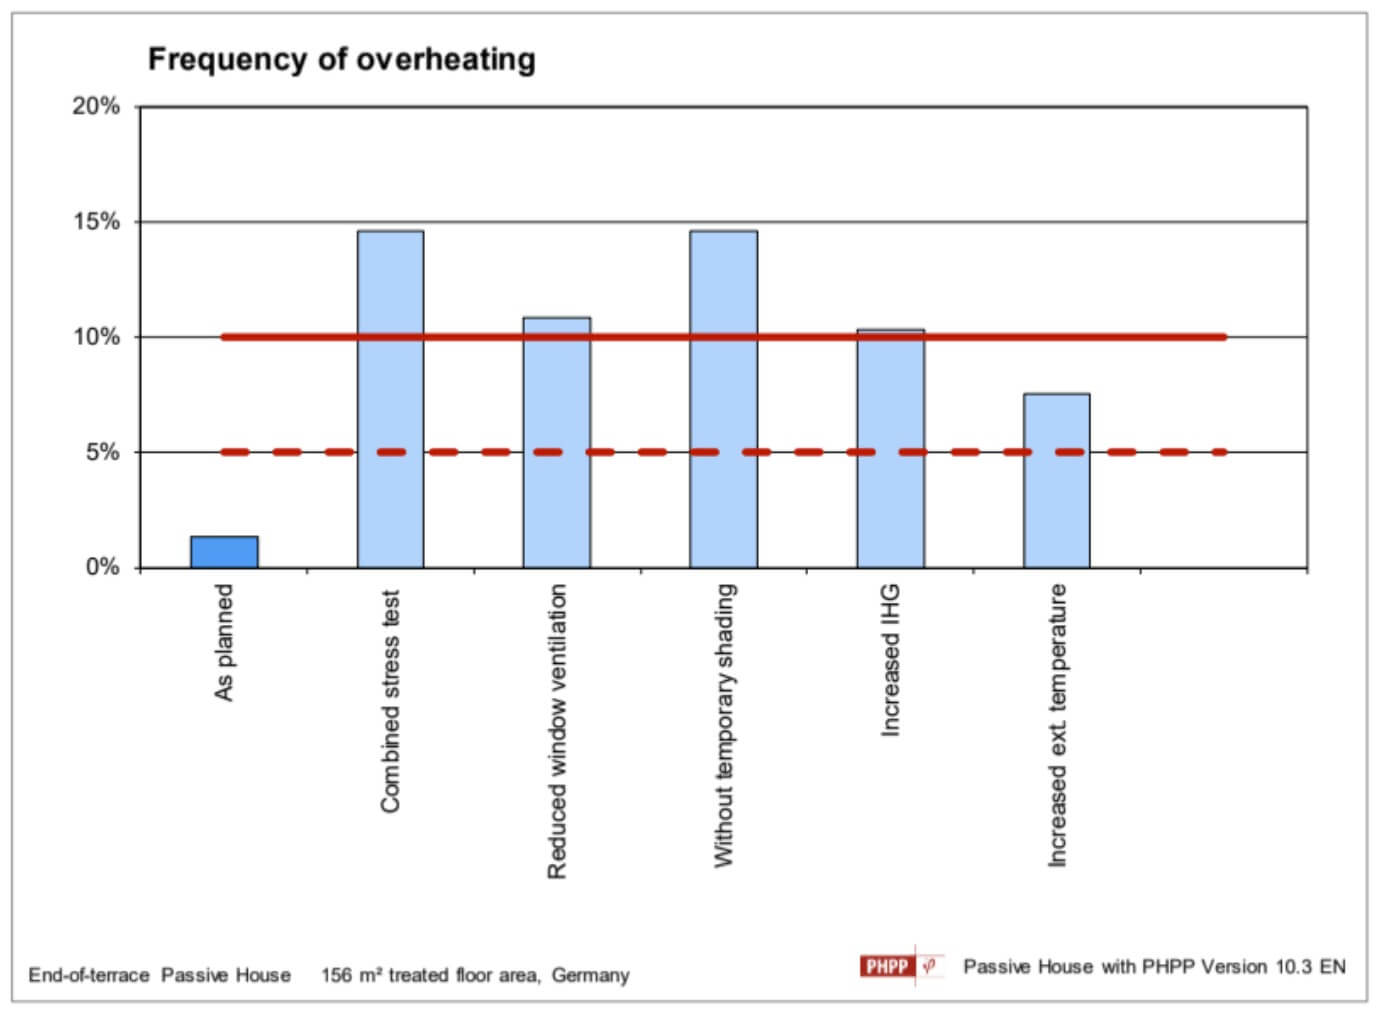
PHi stress test example, PHPP Manual v10
Thermal Bridging Analysis
We are all familiar with u-values for the performance through key surfaces like walls, floors and roofs. At each interface between these surfaces there is a thermal bridge, where heat is more likely to be lost. A complex form with many thermal bridges will exaggerate these weaknesses across the whole building envelope. The default approach is to use standard thermal bridge heat loss coefficient values, described as Psi values (or Ψ-values). For assemblies already tested, values can be input directly.
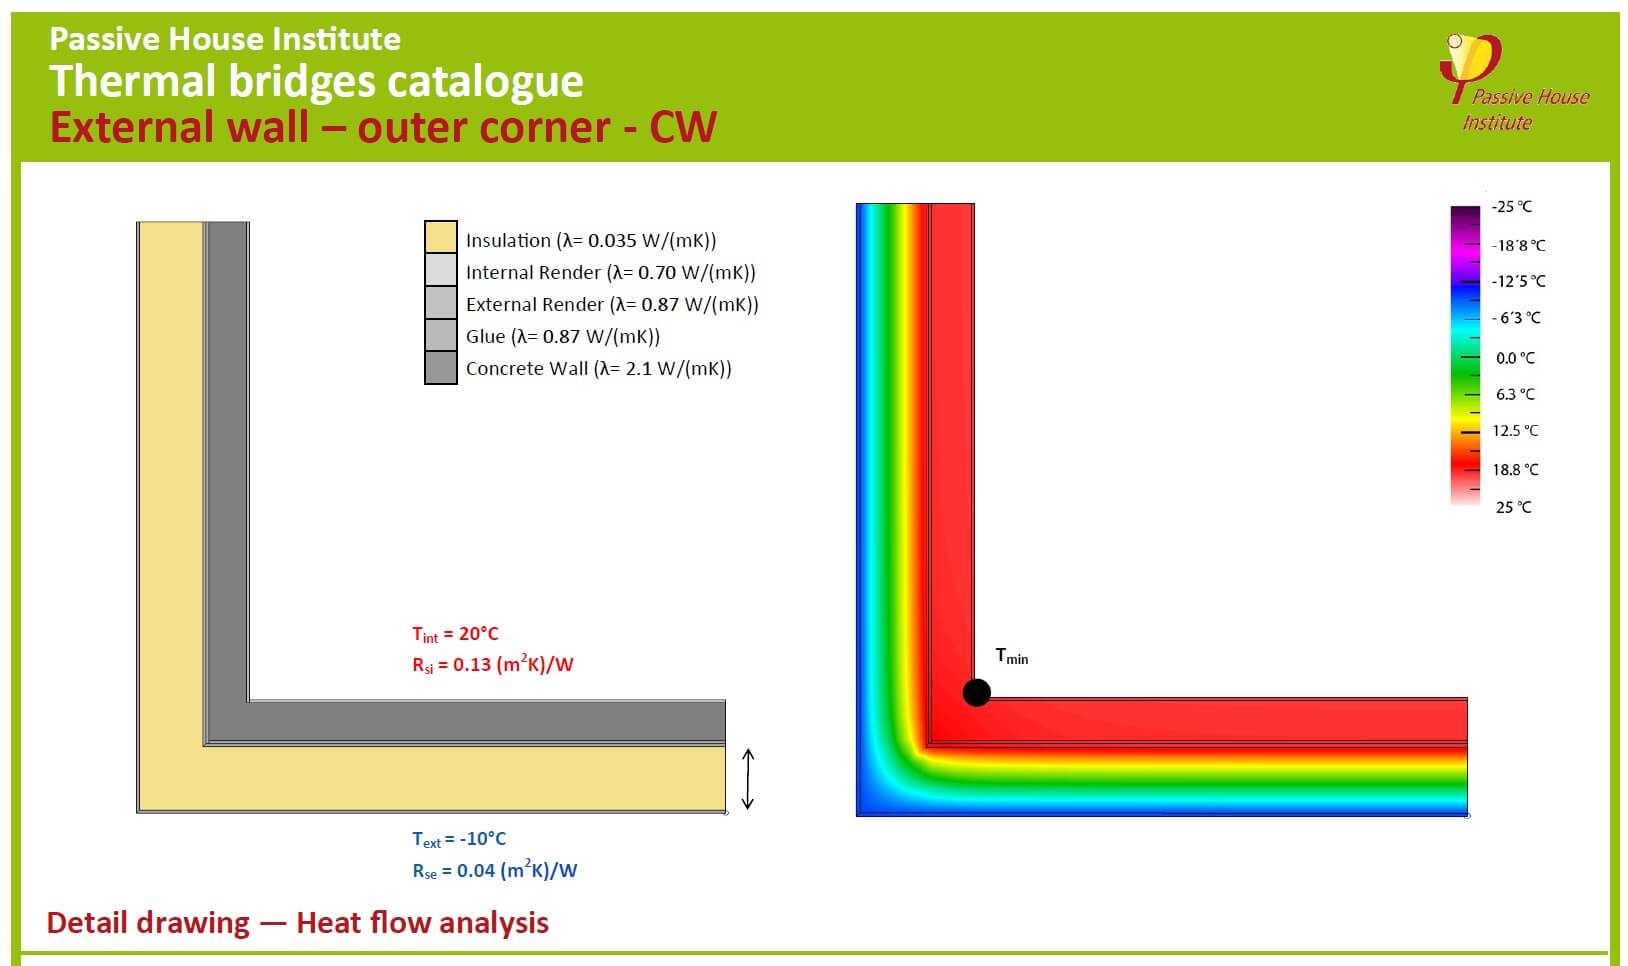
PHi Thermal Bridge Details, example
Thermal bridge analysis illustrates how heat is expected to pass through the fabric. This can be 2D or 3D analysis and is typically represented by heat maps overlaid onto the detail, showing how the insulation is acting upon the natural desire of the internal heat to reach the outside. It can help optimise the insulation thickness at these key junctions and ensure surface temperatures will not drop to a level where condensation can occur, also known as the fRsi value (internal surface temperature factor).
Many third-party software products are available like Therm or AutoPSI but all require training to use. If your design relies on complexity, like a large projecting overhang, then we recommend thermal bridge analysis be undertaken. These can help design out the greater risk that is created by the form and necessary structural connections. Therefore, the added stage of analysis resists stifling your creativity but be aware that complexity always adds risk.
Summary
Energy performance modelling empowers designers with additional information that justifies cost-effective solutions and combats poor choices around ‘value engineering’. Done right, it will save your client money by improving the overall form, establishing the optimal insulation thickness, locations and performance of glazing. It can both encourage bold designs whilst giving them numeric data for estimated bills and payback. Being cognisant of these factors inspires greater confidence and will deliver better outcomes. Getting trained up in these tools can also diversify your skillset.
Right, you’ve been sat here for an hour – are you going to buy this sofa or not?
Related Reading


Author
Written by Alex Bell, BSc(Hons) MArch ARB RIBA CR, Retrofit Architect, Retrofit Coordinator and Passivhaus Designer with 25 years’ experience of design and construction. Alex practises low energy, sustainable design using the Passivhaus principles, EnerPHit or the PAS 2035 Retrofit approach.
Image Credits
CIBSE performance gap
Reality gap: Modelling with CIBSE TM63 to identify performance gaps – CIBSE Journal
